Our Blog
How to Read Hearing Test Results
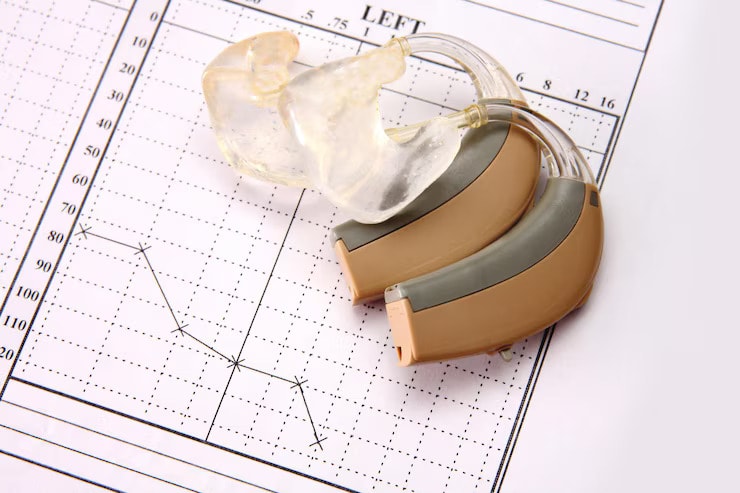
After a hearing test, your audiologist will discuss the results with you in detail. They will explain what the audiogram symbols and shapes mean, and correlate them with your hearing concerns.

Knowing how to read an audiogram yourself could be convenient and advantageous. It also provides a deeper grasp of your hearing ability. However, audiograms can appear complex at first glance. If you want to come more prepared before a hearing test in Toronto, this guide is for you. We’re here to help you decipher your results and discuss them confidently with your hearing professional.
What Is an Audiogram?
An audiogram is a graph generated during a hearing test. It’s essentially a snapshot of your hearing thresholds, which are the softest sounds you can hear at various frequencies. In Canada, hearing loss is one of the leading causes of disability, affecting 19% of adults. This highlights the importance of routine hearing tests, which can be readily identified through an audiogram.
Hearing tests like air conduction testing provide raw data (air conduction thresholds) that gets translated into the visual representation of your hearing. Air conduction results can distinguish moderate hearing loss from severe ones and check general hearing health.
Here’s how the process goes:
-
An audiometer emits calibrated sounds of various frequencies and intensities.
-
It presents sounds one at a time through headphones or a speaker placed near the ear.
-
The patient actively indicates whether they can hear sounds. If they can, they signal when the volume becomes faint.
-
The audiometer maps the range and sensitivity of a person’s hearing by systematically working through different frequencies and intensities.
-
This data is then used to create an audiogram, a visual representation of their hearing ability.
What Do Audiograms Tell You?

Your audiogram reveals several crucial details about your hearing. This includes your hearing threshold and hearing loss type.
Hearing Threshold
The audiogram uses symbols to represent the faintest sounds you can detect at specific frequencies. These symbols indicate your hearing thresholds. The lower the plotted symbol, the better your hearing is for that specific frequency.
Type of Hearing Loss
The pattern formed by these symbols can be a clue to the type of hearing loss you might have. For example, a specific pattern might suggest the following types of hearing loss:
-
Conductive hearing loss (outer or middle ear issue)
-
Sensorineural hearing loss (inner ear or auditory nerve problem)
-
Mixed hearing loss (combined conductive and sensorineural issue)
Additionally, audiogram results can pick up signs of mild to moderately severe hearing loss and low-frequency hearing loss.
How to Read Your Hearing Test Results
These symbols are the first thing you’ll notice on your audiogram: O, X, <, >. They represent your hearing thresholds at different frequencies. Let’s further elaborate below.
Symbol Placement
Your audiogram has a common layout quirk. The symbols on the left side of the graph actually represent your right ear, and vice versa. This is because the audiogram is traditionally oriented for the examiner, not the patient. Once you have this figured out, you can look at the lines next.
Interpreting the Lines
A straight line hovering near the top of the graph signifies normal hearing across all tested frequencies. Deviations from this line, particularly dips or valleys, suggest hearing loss. The lower the symbols fall on the graph for a particular frequency, the greater the degree of hearing loss you have at that specific pitch.
Chart’s Axes
It’s important to understand the two axes on your audiogram graph:
-
Horizontal axis (x-axis): This represents frequency, measured in Hertz (Hz). Low frequencies on the left side correspond to low-pitched sounds like vowels, while high frequencies on the right side represent high-pitched sounds like consonants.
-
Vertical axis (y-axis): This reflects sound pressure level, measured in decibels (dB). Lower dB values indicate softer sounds, while higher dB values represent louder sounds.
Symbols & Abbreviations
There are two types of conduction measured during a hearing test:
-
Air Conduction (O or X): This assesses your outer and middle ear function by presenting sounds through headphones or a speaker near the ear. The symbols O and X represent the results for your right and left ear, respectively.
-
Bone Conduction (< or >): This evaluates the inner ear and auditory nerve function by transmitting sounds directly through the bone behind the ear. The symbols < and > represent the results for your right and left ear, respectively.
Common Hearing Loss Shapes and What They Mean
The pattern formed by the symbols on your audiogram can indicate the type of hearing loss. For instance, a downward slope towards higher frequencies suggests high-frequency hearing loss, often associated with aging. A dip in the low frequencies might indicate noise-induced hearing loss.
Note: If your audiogram shows unexpected dips in the audiogram, it could suggest a blockage of the ears. Check with your audiologist if there’s earwax buildup and consider professional ear flushing in Toronto.
What Is Considered a Good or Normal Result?
Generally, symbols hovering near the top of the graph (around -10 to 20 dB) signify normal hearing ability. As the symbols move down the decibel scale, the degree of hearing loss increases. Categories range from:
-
Mild hearing loss (20-40 dB)
-
Moderate (40-60 dB)
-
Moderately severe (60-80 dB)
-
Severe (80-90 dB)
-
Profound hearing loss (greater than 90 dB)
💡Did You Know?
An audiogram can be a valuable tool used alongside other examinations for tinnitus diagnosis. Certain audiogram patterns might suggest specific inner ear issues that could be linked to tinnitus. If you suspect a high chance, consult an audiologist for tinnitus for proper diagnosis.
Discuss the Results with Your Audiologist
While valuable, an audiogram is just one piece of the puzzle. Discuss your results with your audiologist or hearing care professional. They can interpret the audiogram in conjunction with your medical history and symptoms to determine the cause and severity of any hearing loss. They can also recommend treatment options or suggest the right hearing aids in Toronto for you, should you need one.
They may also consider other hearing tests, such as:
-
Speech Reception Threshold: This test measures the faintest level at which you can understand speech.
-
Tympanometry: This test evaluates the middle ear function by measuring air pressure in the ear canal.
-
Bone Conduction Testing: This assesses the inner ear and auditory nerve function by bypassing the outer and middle ear.
Conclusion
Your hearing test results can say a lot about your general hearing health and determine potential hearing loss issues. Conversely, it can also help you explore options to improve your hearing ability and understand sounds around you better. Knowing even the basics on how to read an audiogram can help you discuss the results more comprehensively with your audiologist.
